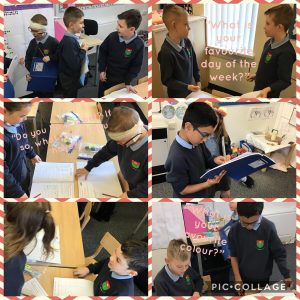
This week in maths Y3 have been looking at statistics. On Wednesday 6th February we created our own question to ask each other in the class. We collected our data and recorded answers using a tally chart. With our data we created our own bar charts. On Thursday 7th February we then created our own one-step and multi-step questions about frequency charts, pictograms and tables.